We have results from the Inductively Coupled Plasma Mass Spectronomy (ICP-MS), but have not yet processed the data. (Click here for a short explanation of what the ICP-MS is). Two things that seem promising, though, are the facts that the Calcium Carbonate was so saturated that the machine couldn't obtain an accurate measurement and aluminum was present in the ossicles. The first thing is unusual due to the fact that the sample size consisted of milligrams (not even grams) of ossicles which, like all bones, contain lots of calcium carbonate, but usually not in such high saturation. Also, the fact that aluminum is embedded in the tiny bones is strange in light of recent findings that aluminum is a neurotoxin that, though abundant in nature, is not an essential element and poses a threat to organisms. However, in an analysis of iridescent fish scales it was found that there were high concentrations of aluminum that might play a part in the scales' light refraction. Since we already found out that the ossicles are specialized for fluorescent light transmission by transmitting green visible light wavelengths, it is possible that aluminum also enhances the ossicles' light enhancing properties.
Since we were unable to get a calcium reading with our previous samples, I'll be sorting and prepping new samples (about 1/10 of the amount we tested last time) for another ICP analysis. Hopefully there won't be a saturation of calcium in these readings since the proportion of Calcium Carbonate is what we compare all the other measurements to in order to create ratios of metals to calcium. (I.e. there are 10 parts Calcium and 1 part Magnesium.) Once that's done we'll have to make sense of all the measurements and numbers and proportions.
Showing posts with label Marine Organisms. Show all posts
Showing posts with label Marine Organisms. Show all posts
Wednesday, October 19, 2011


Thursday, October 13, 2011
Prepping for the Plasma Machine (ICP)
Hours upon hours of ossicle sorting have almost paid off—we're finally going to analyze the samples using the ICP-MS.
I'll explain in a moment, but first: some ossicle samples from the brittle star O. californica were analyzed using hypo-spectronomy and found to transmit light between wavelengths of 530 and 590 nanometers—the spectrum of visible green light—which happens to be the color of brittle star bioluminescence. Therefore, it is very likely that the tiny bones in the arms of certain brittle stars are optimized to transmit and ideally amplify the light from their luminescent reactions. How amazing is that?! These are specialized bones in a specific luminescent system that aid in defense or mating or whatever else the brittle stars use luminesce for. Well, anyways, I was excited.
Okay. Back to the issue of ICP analysis.
ICP-MS stands for Inductively Coupled Plasma Mass Spectronomy. As another intern explained to me, it is the process of heating up argon gas into the fourth state of matter, that is, plasma. Once there is plasma in the chamber of the machine, samples (which need to be in liquid form) are sent into the chamber in a kind of mist after being nebulized. The drops vaporize near the plasma and solids break down into individual atoms after being vaporized and certain chemical elements are ionized. These ions are sorted in a special device for mass spectronomy, which can determine the presence of elements of atomic mass 7 to 250 and their proportions in the sample. In the case of the brittle star ossicles, we want to find out how much of what elements are in the bones of luminescent brittle star species compared to proportions of the same elements in non-luminescent species in order to determine if those elements (mainly metals) play any role in specialized light transmission and refraction.
During this and last week, I continued to sort more of the A. pujetana ossicles since I had less of that sample compared to my O. californica and A. squamata samples. I sorted as much as I could on Thursday and then weighed all the samples. All the weighing and digesting, etc. had to be done in order so that it would be easier to organize the samples once we got the results back from the ICP. The order I used was: Blank_1, Blank_2, Blank_3, OCL, OCT, OCV, ASL, AST, ASV, APL, APT, APV. The first two initials stand for the species name (i.e. O. californica) and the last letter stands for what kind of ossicle it is, that is, Lateral Shield, Top/Bottom Shield, or Vertebrae.
After the ossicles were weighed, I added approximately 150 microliters of 70% Nitric Acid (or about two large drops from a disposable glass pipette) to each tube in order to dissolve the samples into a liquid. A glass pipette was used instead of the more accurate mechanical pipette because Nitric Acid is so strong it or its fumes could potentially harm the sensitive measuring device in a normal pipette and make it unusable or in need or serious repair. Once the acid was added, the ossicles sat for 12 or more hours to insure optimum digestion.
 The container and tube were tared, then the sample was added. The weight (usually in milligrams) was recorded in a text file on the computer that the scale was hooked up to. [Note: in the picture it shows a tube with a cap on; in the actual weighing the cap was never put on in the scale due to the fact that if more grams are tared the less accurate the measurements of the samples will be.]


I have yet to get the results from the ICP, but am nonetheless optimistic that they will be quite interesting and certainly worth a follow-up post!
I'll explain in a moment, but first: some ossicle samples from the brittle star O. californica were analyzed using hypo-spectronomy and found to transmit light between wavelengths of 530 and 590 nanometers—the spectrum of visible green light—which happens to be the color of brittle star bioluminescence. Therefore, it is very likely that the tiny bones in the arms of certain brittle stars are optimized to transmit and ideally amplify the light from their luminescent reactions. How amazing is that?! These are specialized bones in a specific luminescent system that aid in defense or mating or whatever else the brittle stars use luminesce for. Well, anyways, I was excited.
Okay. Back to the issue of ICP analysis.
ICP-MS stands for Inductively Coupled Plasma Mass Spectronomy. As another intern explained to me, it is the process of heating up argon gas into the fourth state of matter, that is, plasma. Once there is plasma in the chamber of the machine, samples (which need to be in liquid form) are sent into the chamber in a kind of mist after being nebulized. The drops vaporize near the plasma and solids break down into individual atoms after being vaporized and certain chemical elements are ionized. These ions are sorted in a special device for mass spectronomy, which can determine the presence of elements of atomic mass 7 to 250 and their proportions in the sample. In the case of the brittle star ossicles, we want to find out how much of what elements are in the bones of luminescent brittle star species compared to proportions of the same elements in non-luminescent species in order to determine if those elements (mainly metals) play any role in specialized light transmission and refraction.
During this and last week, I continued to sort more of the A. pujetana ossicles since I had less of that sample compared to my O. californica and A. squamata samples. I sorted as much as I could on Thursday and then weighed all the samples. All the weighing and digesting, etc. had to be done in order so that it would be easier to organize the samples once we got the results back from the ICP. The order I used was: Blank_1, Blank_2, Blank_3, OCL, OCT, OCV, ASL, AST, ASV, APL, APT, APV. The first two initials stand for the species name (i.e. O. californica) and the last letter stands for what kind of ossicle it is, that is, Lateral Shield, Top/Bottom Shield, or Vertebrae.
After the ossicles were weighed, I added approximately 150 microliters of 70% Nitric Acid (or about two large drops from a disposable glass pipette) to each tube in order to dissolve the samples into a liquid. A glass pipette was used instead of the more accurate mechanical pipette because Nitric Acid is so strong it or its fumes could potentially harm the sensitive measuring device in a normal pipette and make it unusable or in need or serious repair. Once the acid was added, the ossicles sat for 12 or more hours to insure optimum digestion.

 |
| "JUSTRITE: Acids and Corrosives Storage Cabinet" |
 |
| Not More than 70% Nitric Acid. It's extremely bad for your health (note the skull and crossbones), severely reactive, and extremely dangerous on contact, but worry not! it's not flammable. You need to wear goggles & shield, lab coat & apron, and proper gloves when using this acid under a vent hood. |
 |
| The amazing vent hood, which, in the clean room, is always blowing on high, keeping this part of the lab at high negative pressure and sucking out any harmful or plain stinky acid or chemical smells. |
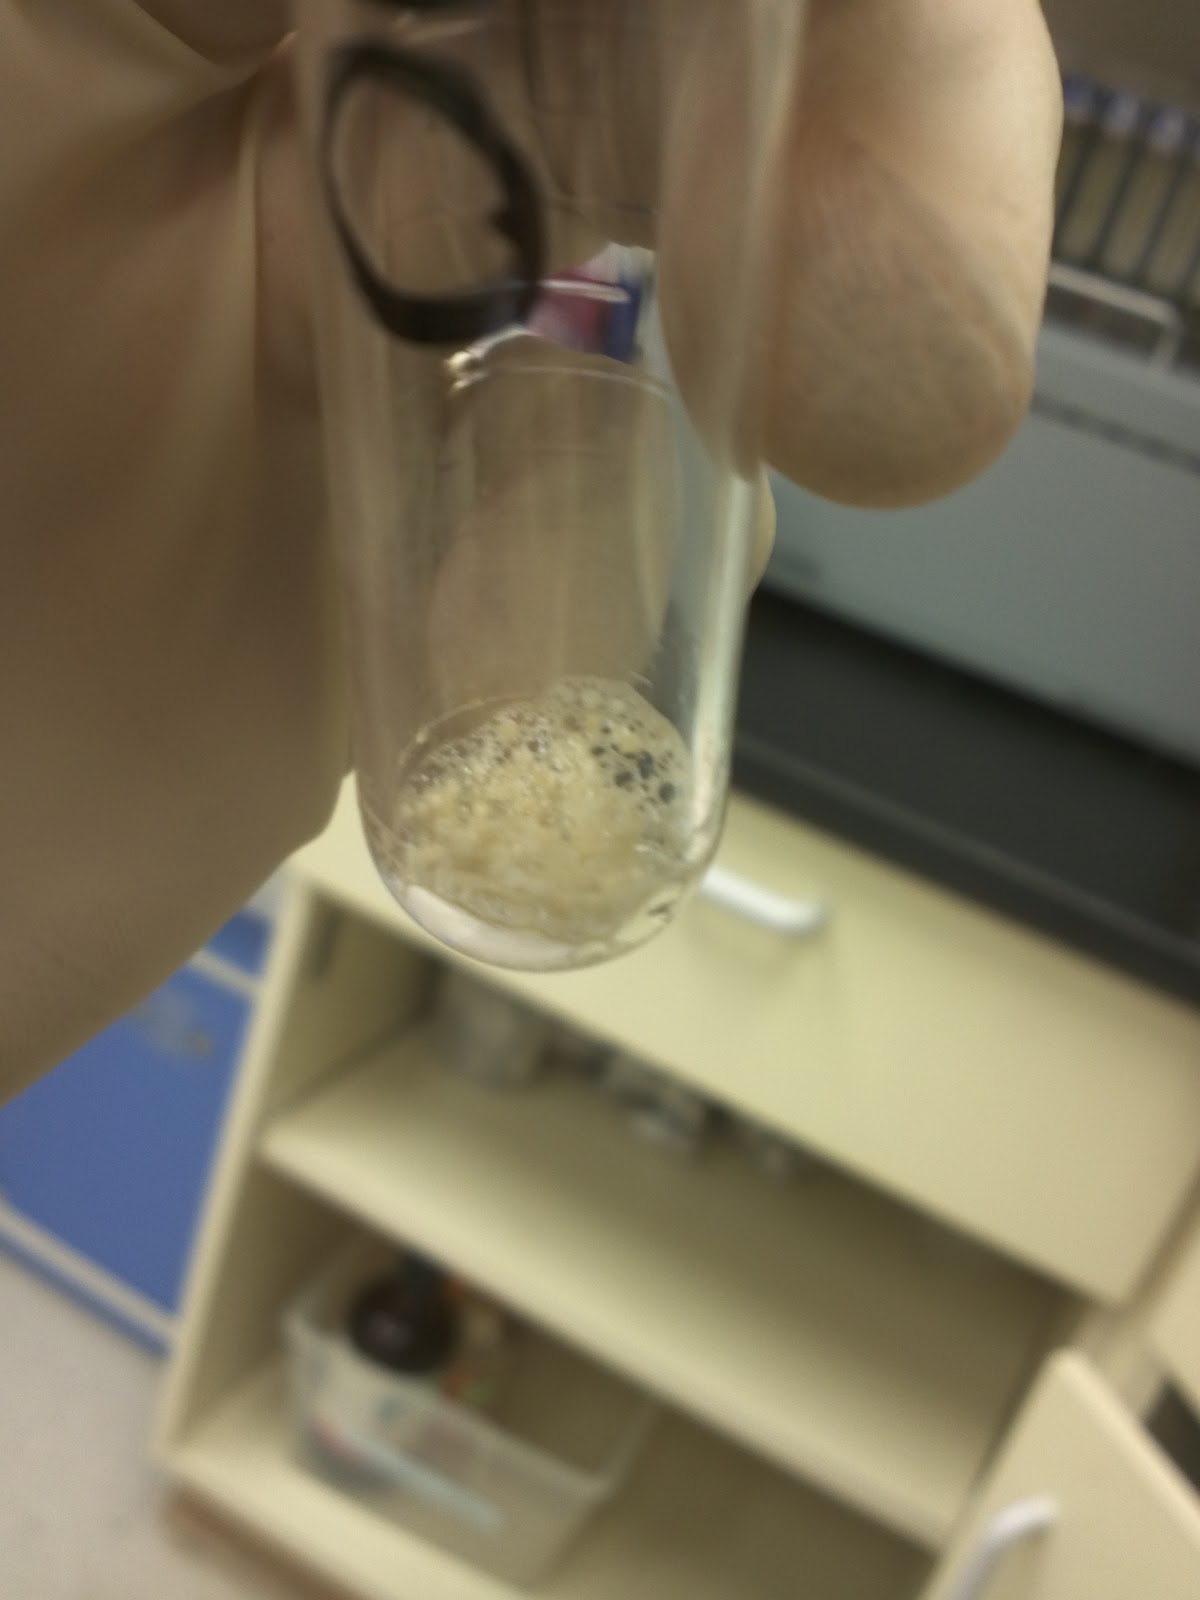
In the pictures below, acid is added to the sample of O. californica vertebral ossicles and bubbling occurs due to the reaction between the calcium carbonate in the tiny bones and the Nitric Acid, which facilitates the creation and release of Carbon dioxide gas.


 |
| The tubes, once the sample and acid are weighed, are put in a tube rack under the fume hood so that the acid can fully dissolve the ossicles into a fluid liquid to be diluted with MilliQ water after full digestion. The resultant liquid will be nebulized into the ICP-MS for analysis. |
 |
| I recorded the weights on the computer and in my notebook. Notice how minuscule the sample sizes are in terms of weight (in grams). |
I have yet to get the results from the ICP, but am nonetheless optimistic that they will be quite interesting and certainly worth a follow-up post!
Thursday, September 1, 2011
A Day of Photo Microscopy
Two other interns in my lab, David and Caitlin are photographically analyzing fish scales to see if their coloration and iridescence is due to structure or pigmentation. In order to do this, they take photos of raw fish scales under white, green, cyan, and blue light. The whole scale, the outside and inside edges, and the center are all photographed. Different exposure settings (as determined by Auto-Exposure) are used for white light and green light; but the exposure under green, cyan, and blue light remains the same. Once pictures of the raw scales are complete, scales soaked in an enzyme that digests fish flesh and any pigmentation are photographed using the same protocols. If there is still coloration or iridescence on the digested scales (which end up being very translucent), then that might signify structural coloration or iridescence in the scales of that particular fish. There have been no conclusive results as of yet, however, we are still in the process of photographing numerous samples from quite a few different colorful fish species.
The scales below were pulled from an orange and black Clarion Angelfish that probably looked like the picture below when alive:

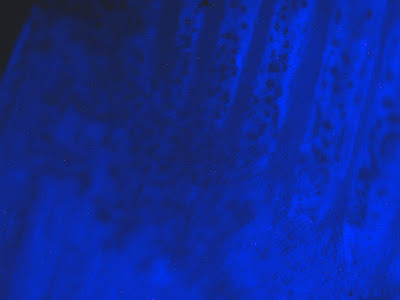
These are all pictures of the black scales. Most of the scale looks translucent. This is because most of the coloration is at the very end of the scale (far left in picture). When the magnification is increased, there are black dots that become more distinguishable. Is it these small dots alone that give the fish its black color? Is the coloration due to pigment or the structure of the scale? These are questions we seek to answer. But first, at least a couple of black scales had to be photographed.
Note: If you click on the picture, it will open up in its actual size, allowing you to see the high resolution and detail that the microscope camera is capable of.


Well, if you made it to the end (or just skipped on down here), then I'd first like to congradulate you. When a phase of this project is nearing conclusion, tens and tens more photos will have to be looked through, compared, analyzed, etc. to give an accurate photographic analysis of whether or not fish scale iridescence and coloration is due to pigmentation or structure. It is interesting to note that this is only one set of photos for only one scale. There are always more than 2 sets of photos per scale color according to location on the fish, which means there are anywhere from 6 to 10 photo-sets per fish, and this was Fish #7. Not to mention that I'm not counting the photo sets of digested scales, which these photos will be juxtaposed with.
In addition, this is one of several photo sets I took of the Clarion Angelfish scales.
The scales below were pulled from an orange and black Clarion Angelfish that probably looked like the picture below when alive:

These are all pictures of the black scales. Most of the scale looks translucent. This is because most of the coloration is at the very end of the scale (far left in picture). When the magnification is increased, there are black dots that become more distinguishable. Is it these small dots alone that give the fish its black color? Is the coloration due to pigment or the structure of the scale? These are questions we seek to answer. But first, at least a couple of black scales had to be photographed.
Note: If you click on the picture, it will open up in its actual size, allowing you to see the high resolution and detail that the microscope camera is capable of.
Black Scale One Face Up (Some Overlap)
Full Scale View:


Detail of Tips, note the black dots especially in the second picture

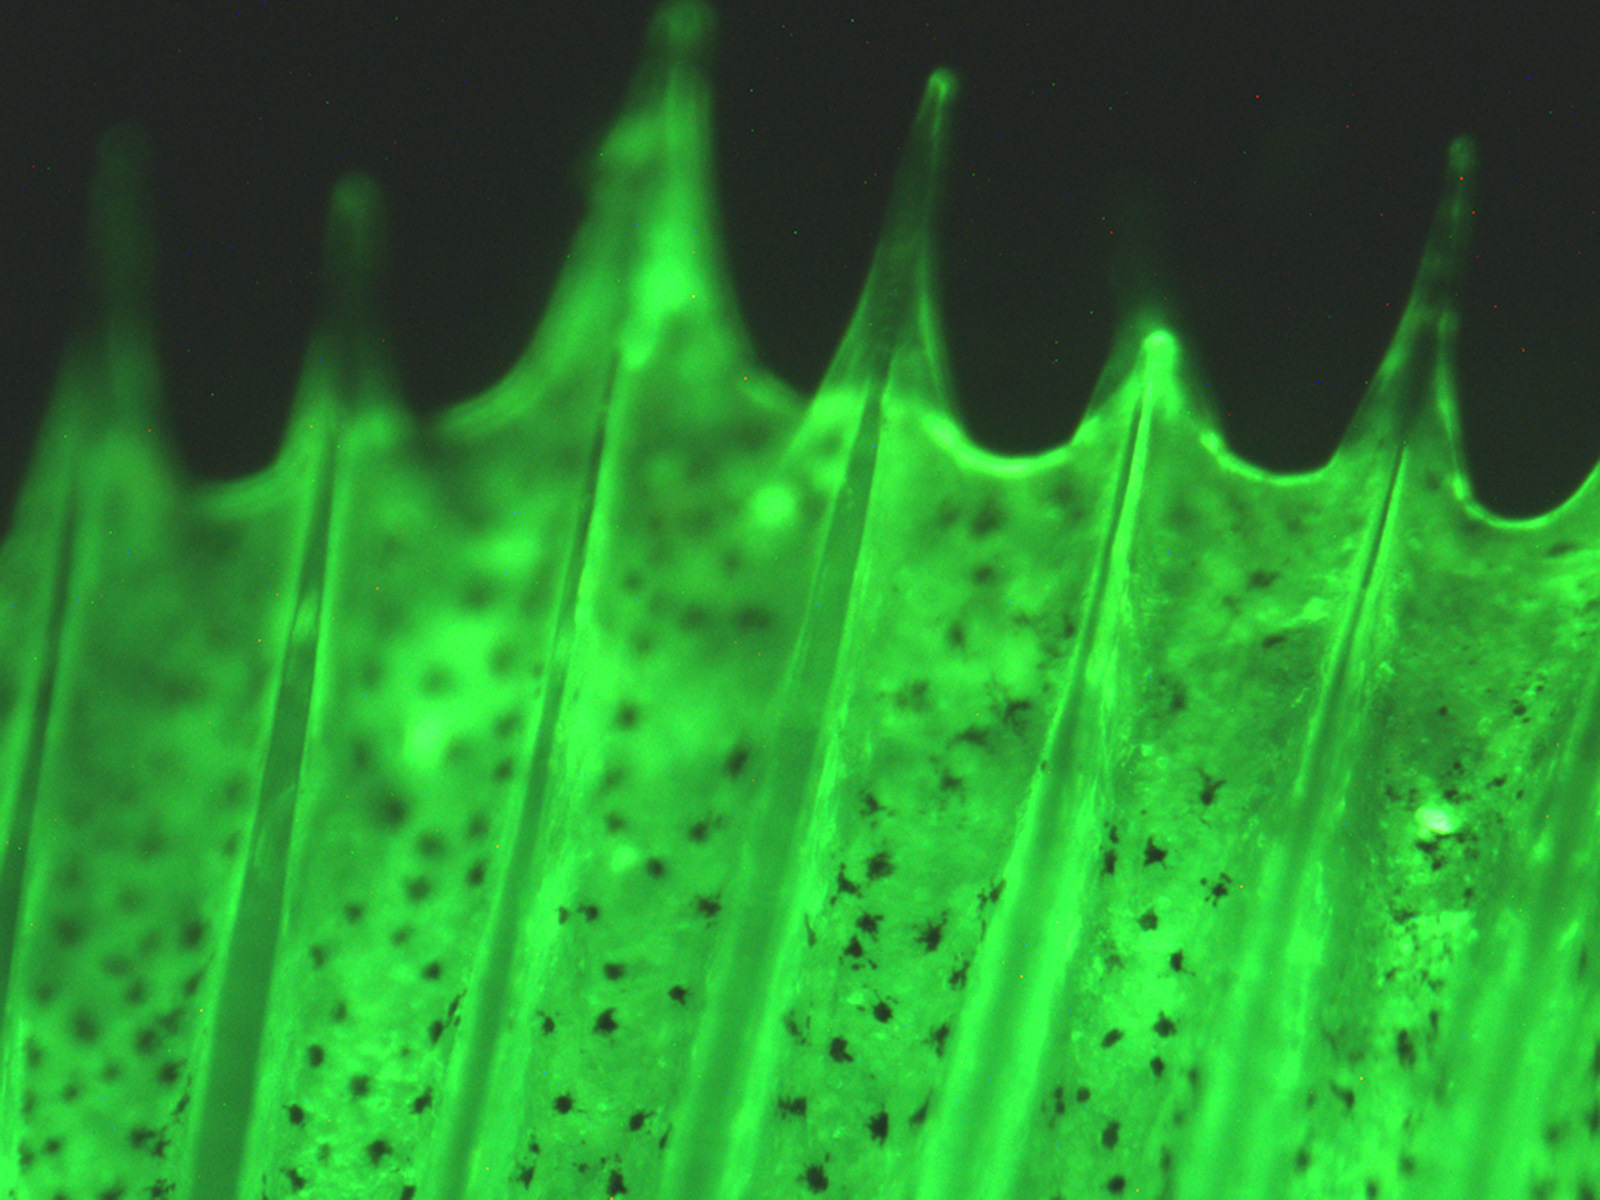


Bottom edge that is usually under other scales on the fish


A small overlapping scale with lots of visible black dots
(from what Caitlin told me, an overlapping scale isn't as common as you'd think)


Middle of the Scale


Higher Magnification Center of Scale


Black Scale One Underside


Well, if you made it to the end (or just skipped on down here), then I'd first like to congradulate you. When a phase of this project is nearing conclusion, tens and tens more photos will have to be looked through, compared, analyzed, etc. to give an accurate photographic analysis of whether or not fish scale iridescence and coloration is due to pigmentation or structure. It is interesting to note that this is only one set of photos for only one scale. There are always more than 2 sets of photos per scale color according to location on the fish, which means there are anywhere from 6 to 10 photo-sets per fish, and this was Fish #7. Not to mention that I'm not counting the photo sets of digested scales, which these photos will be juxtaposed with.
In addition, this is one of several photo sets I took of the Clarion Angelfish scales.
Subscribe to:
Posts (Atom)